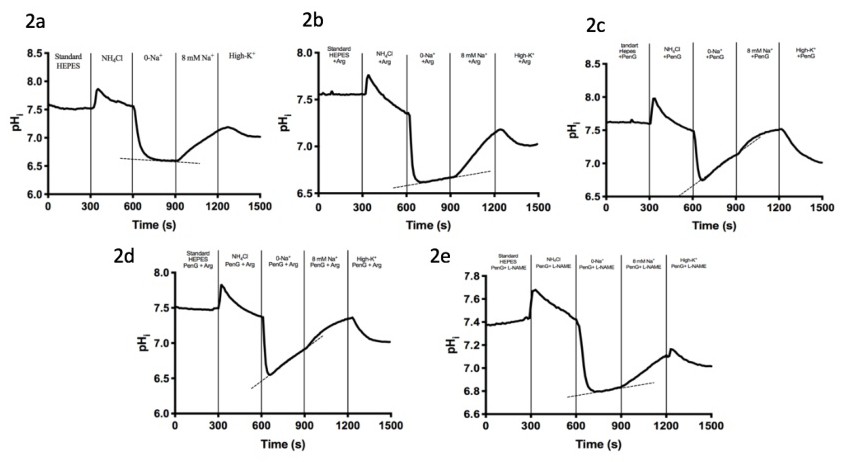
Fig. 2. Sample pHi profiles of individual colonic crypts, using the ammonium chloride prepulse technique. Original tracing of pHi changes of a single colonic crypt during a particular experiment. The mean pHi recovery rate of the crypt during the 0-Na+ phase is quantified and represented by the dashed line. Sample tracings of pHi changes of a single colonic crypt is shown under all five conditions: control (1a); arginine (1b); penicillin (1c); penicillin + arginine (1d); penicillin + L-NAME (1e). The sequence of solutions under each condition is as follows: i.) Standard HEPES ii.) NH4Cl, iii.) 0-Na+ iv.) 8 mM Na+ v.) High-K+.